Real Estate
Hedonic Home Value Index


Hedonic Home Value Index
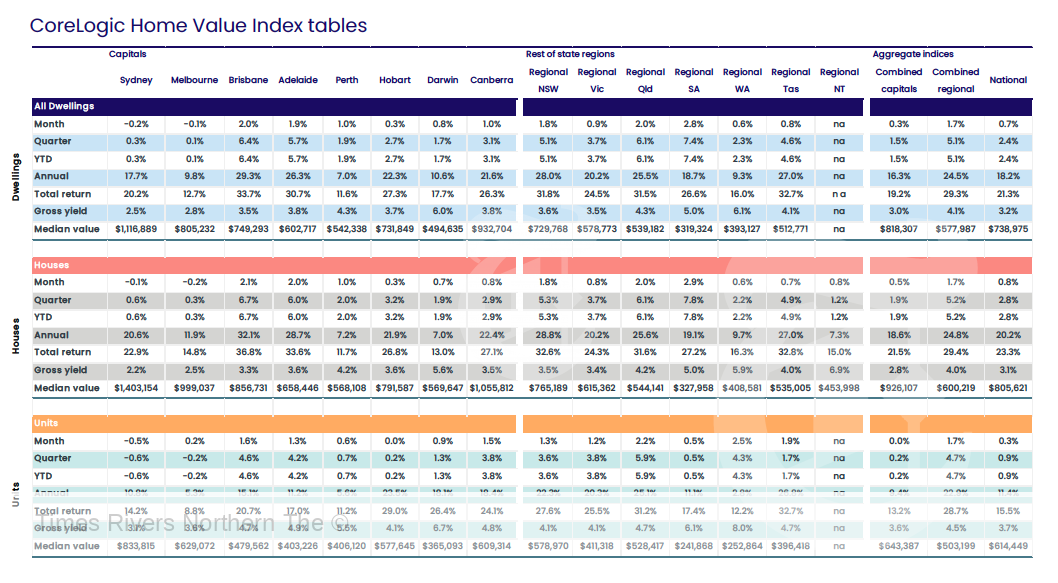
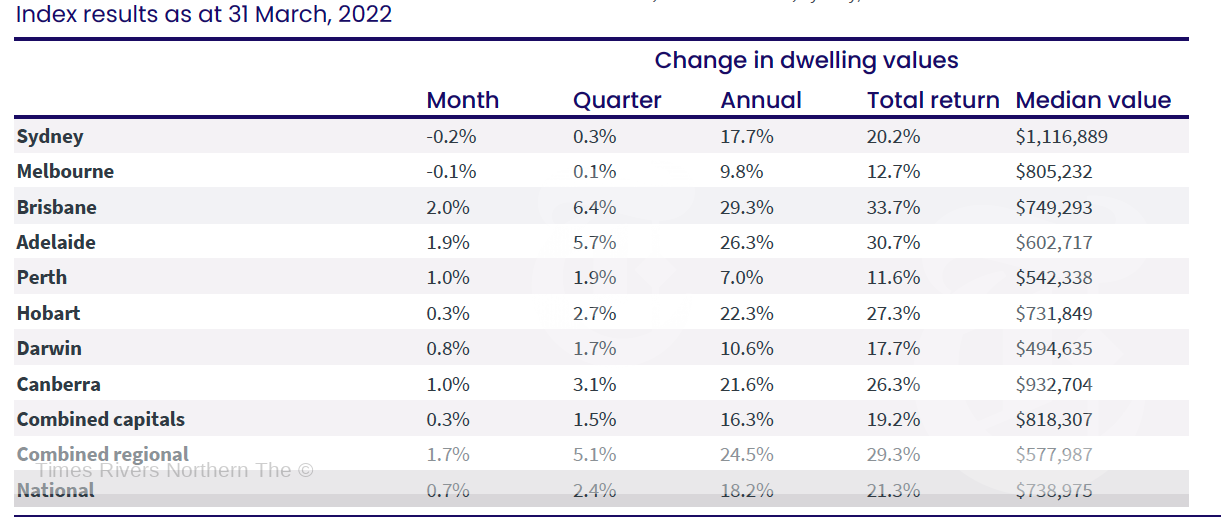
CoreLogic: Australia’s smallest cities drive growth in national housing values as Sydney and Melbourne decline CoreLogic’s national Home Value Index (HVI) was up 0.7% in March, a subtle increase on the 0.6% lift recorded in February. The uptick in the monthly rate of growth was primarily driven by stronger conditions in Brisbane, Adelaide, Perth and the ACT, along with several regional areas, offsetting a slip in values across Sydney and Melbourne.
The first quarter of the year has seen Australian dwelling values rise by 2.4%, adding approximately $17,000 to the value of an Australian dwelling. A year ago, values were rising at more than double the current pace, up 5.8% over the three months to March 2021 before the quarterly rate of growth peaked at 7.0% over the three months ending May 2021.
Sydney’s growth rate is showing the most significant slowdown, falling from a peak of 9.3% in the three months to May 2021, to 0.3% in the first quarter of 2022. Melbourne’s housing market has seen the quarterly rate of growth slow from 5.8% in April last year to just 0.1% over the past three months.
CoreLogic’s research director, Tim Lawless, says while the monthly rate of growth was up among some cities and regions, there is mounting evidence that housing growth rates are losing momentum.
“Virtually every capital city and major rest-of-state region has moved through a peak in the trend rate of growth some time last year or earlier this year,” Mr Lawless said.
“The sharpest slowdown has been in Sydney, where housing prices are the most unaffordable, advertised supply is trending higher and sales activity is down over the year.”
“There are a few exceptions to the slowdown, with regional South Australia recording a new cyclical high over the March quarter and some momentum is returning to the Perth market where the rate of growth is once again trending higher since WA re-opened its borders.”
With the softening in market conditions, the national annual growth rate (18.2%) has fallen below the 20% mark for the first time since August last year, after reaching a cyclical high of 22.4% in January 2021.
Mr Lawless said the annual growth trend will fall sharply in the coming months, as the strong gains recorded in early 2021 drop out of the 12-month calculation.
National housing turnover is also easing, with preliminary transaction estimates for the March quarter tracking 14.3% lower than the same period in 2021, but still 12.2% above the previous five-year average.
“Nationally, the volume of housing sales is coming off record highs but there is some diversity across the capital cities in these figures as well. Our estimate of sales activity through the March quarter is 39% lower than a year ago in Sydney and 27% lower in Melbourne, while stronger markets like Brisbane and Adelaide have recorded a rise in sales over the same period.”
Regional Australia continues to show some resilience to a slowdown with housing values across the combined regional areas rising at more than three times the pace of the combined capital cities through the March quarter. Regional dwelling values increased 5.1% in the three months to March, compared with the 1.5% increase recorded across the combined capital cities. The rolling quarterly growth rate in regional dwelling values has consistently held above the 5% mark since February 2021.
Australian Bureau of Statistics (ABS) regional population growth figures for FY2020-21 help explain the strong housing conditions outside of the capitals. The number of people living in regional areas of Australia increased by almost 71,000 residents, while residents living in the capitals fell by approximately 26,000 (mostly due to a sharp drop in Melbourne and, to a lesser extent, Sydney).

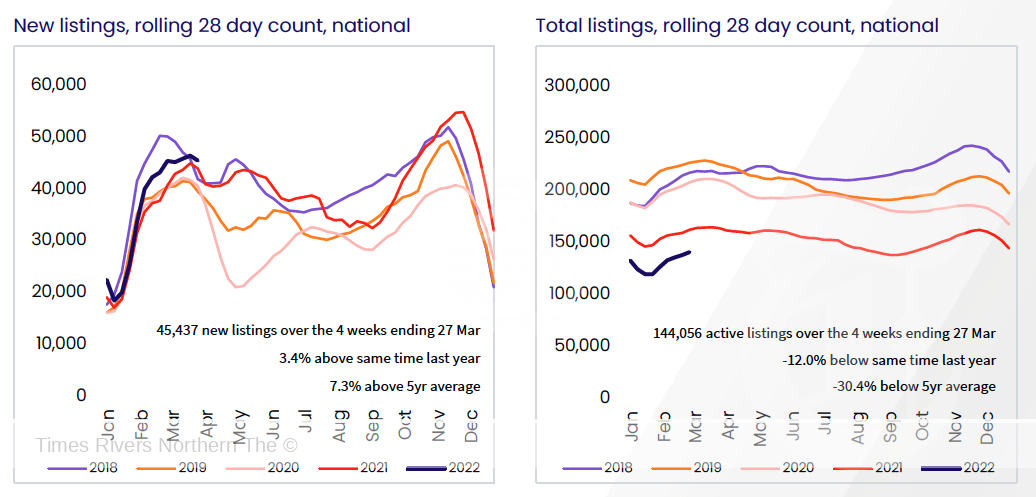
Trends in property listings continue to help explain the divergence in housing growth trends.
Advertised inventory, at a national level, is tracking 30% below the previous five-year average over the four weeks ending March 27. However, a more detailed analysis of each capital city highlights significant differences in the total number of homes available to purchase.
In Melbourne, total advertised supply was 8% above the previous five-year average towards the end of March, while the number of homes available to purchase in Sydney had virtually normalised to be 7.5% higher than a year ago and only 2.6% below the five-year average. Higher stock levels across these markets can be explained by an above average flow of new listings coming on the market in combination with a drop in buyer demand.
“With higher inventory levels and less competition, buyers are gradually moving back into the driver’s seat. That means more time to deliberate on their purchase decisions and negotiate on price,” Mr Lawless said.
In contrast, advertised stock levels in Brisbane and Adelaide remain more than 40% below the previous five-year average levels and around 20% to 25% down on a year ago. It’s a similar scenario across regional Australia, where total advertised housing stock was 22% below last year’s level and 43% below the previous five-year average. Such low inventory levels along with persistently high buyer demand continues to create strong selling conditions in these areas, supporting the upwards pressure on prices.


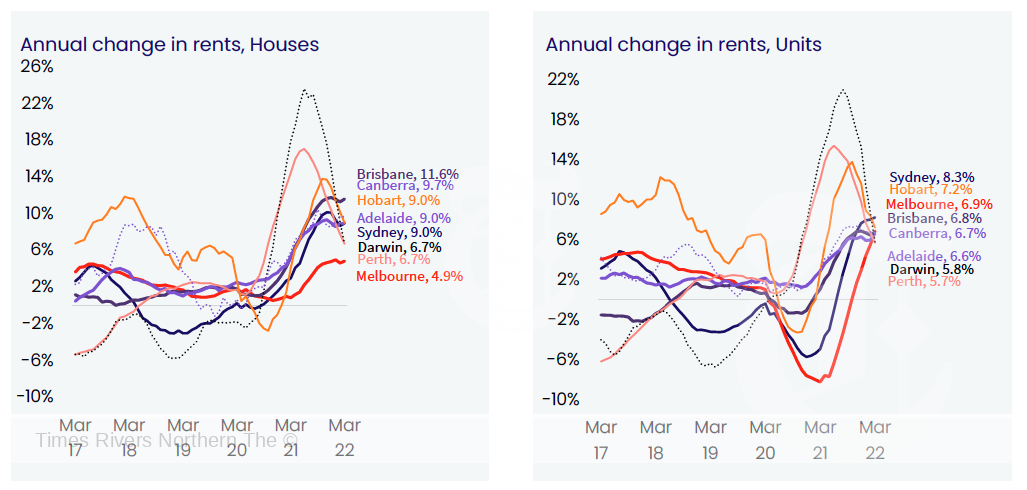
Rental trends are becoming increasingly diverse across Australia. At a macro level, rents are still rising at well above average rates. While annual rental growth has eased from a recent peak of 9.4% in November last year to 8.7% over the 12 months ending March 2022, the quarterly pace of growth has rebounded through the first quarter of the year, from 1.9% in Dec 2021 to 2.6%
in March 2022.
The rebound is partly seasonal as rental trends tend to be stronger through the first quarter of the year, but there are other factors at play including stronger conditions across the medium to high
density rental sector.
The rate of growth in unit rents has strengthened to reach a cyclical high of 3.0% in the March quarter, rising at a materially faster pace than house rents (2.4%). The stronger rental conditions across the unit sector demonstrates a remarkable turnaround in rental conditions across higher density markets, where rents fell sharply through the first nine months of the pandemic.
“Through the pandemic to-date, capital city house rents have risen by 13.8% compared with a 3.4% rise in unit values,” Mr Lawless said.

returning to offices and inner city precincts regaining some vibrancy, are likely key factors pushing unit rents higher,” Mr Lawless said.

Sydney is now recording the strongest lift in unit rents, up 8.3% over the 12 months to March following a 7.2% peak to trough fall in the first half of the pandemic. Similarly, Melbourne unit rents are
up 6.9% over the past year after posting an 8.5% peak to trough fall.
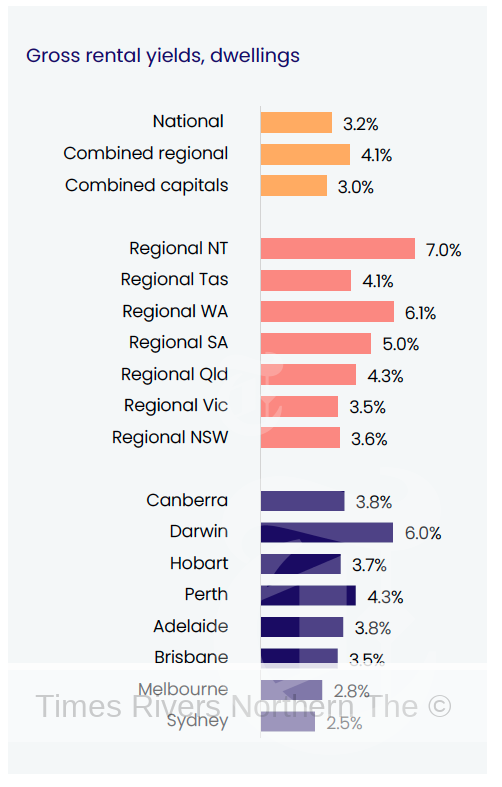
With national rents up 2.6% over the March quarter and housing values rising by a lower 2.4%, gross yields have posted a rare rise in March, up two basis points from a record low of 3.21% in January and February to 3.23%. If rents continue to outpace housing values, which is likely if the housing market moves into a downturn, yields will continue to recover.

At one end of the spectrum Australia’s two largest cities, Sydney and Melbourne, are recording flat to falling housing values, while at the other is Brisbane and Adelaide, where the quarterly pace of growth continues to rise at an annualised pace of more than 20%. Perth too is re-accelerating off a low base, which can, at least partially, be attributed to state borders re-opening, and regional markets are mostly strong as population growth runs up against low available supply levels.
Despite the diversity, the outlook for housing remains skewed to the downside.

variable mortgage rates later this year are only part of the reason why housing markets are likely to soften as 2022 progresses. Other factors include:

• Affordability – With housing values rising so much more than incomes over the past two years, it has become harder for prospective buyers to access the market. Saving for a deposit and funding transactional costs is a significant hurdle for a growing number of prospective buyers.
• Inflation – Higher costs of living are also likely to weigh on housing demand. Higher inflation implies less disposable income and lower household savings which could make it harder for prospective buyers to raise a deposit and demonstrate their ability to service a new loan commitment. A surge in household savings through the pandemic has been a supporting factor for housing demand, however as the economy returns to the new normal, households are saving less; a trend likely to become more pronounced through the year.
• Higher supply – Both newly constructed dwellings and a rise in advertised listings is likely to gradually skew housing market conditions in favour of buyers, providing more choice and an opportunity to negotiate with less urgency around decision making.
• Sentiment – Consumer confidence has taken a turn for the worse over recent months, with the weekly reading from ANZ and Roy Morgan falling to the lowest level in about 18 months. Historically, consumer sentiment and housing market activity have shown a close relationship. Below average sentiment, along with slowing housing markets and the prospect of rising interest
rates, is likely to cause prospective buyers to think twice before engaging with the housing market.
However, there are other factors that should help to offset the downside risk.
• A strengthening economy, low jobless rate and rising income growth – This should help to keep a floor under housing demand and keep the number of distressed listings to a
minimum through a downturn.
• A new round of incentives for first home buyers – In the leadup to the federal election both major political parties have already announced additional support for first home buyers in
the form of an extension to low deposit home loan guarantees. Historically, first home buyers have reacted positively to stimulus measures.
• A return of migration – Higher overseas migration is a net positive for housing demand. The most immediate flow through is likely to be seen in higher rental demand which could
incentivise investors and, in the longer term, flow through to purchasing demand from permanent migrants.


Methodology
The CoreLogic Hedonic Home Value Index is calculated using a hedonic regression methodology that addresses the issue of compositional bias associated with median price and other measures. In simple terms, the index is calculated using recent sales data combined with information about the attributes of individual properties such as the number of bedrooms and bathrooms, land area and geographical context of the dwelling. By separating each property into its various formational and locational attributes, observed sales values for each property can be distinguished between those attributed to the property’s attributes and those resulting from changes in the underlying residential property market. Additionally, by understanding the value associated with each attribute of a given property, this methodology can be used to estimate the value of dwellings with known characteristics for which there is no recent sales price by observing the characteristics and sales prices of other dwellings which have recently transacted. It then follows that changes in the market value of the entire residential property stock can be accurately tracked through time. The detailed methodological information can be found at:
https://www.corelogic.com.au/research/rp-data-corelogichome-value-index-methodology/
CoreLogic is able to produce a consistently accurate and robust Hedonic Index due to its extensive property related database, which includes transaction data for every home sale within every state and territory. CoreLogic augments this data with recent sales advice from real estate industry professionals, listings information and attribute data collected from a variety of sources.
About the data
Median value refer to the 50th percentile of valuation estimates observed in the region Growth rates are based on changes in the CoreLogic Home Value index, which take into account value changes across the market Only metrics with a minimum of 20 sales observations and a low standard error on the median value have been included Data is at March 2022
Median value refer to the 50th percentile of valuation estimates observed in the region
Growth rates are based on changes in the CoreLogic Home Value index, which take into account value changes across the market
Only metrics with a minimum of 20 sales observations and a low standard error on the median value have been included
Data is at February 2022